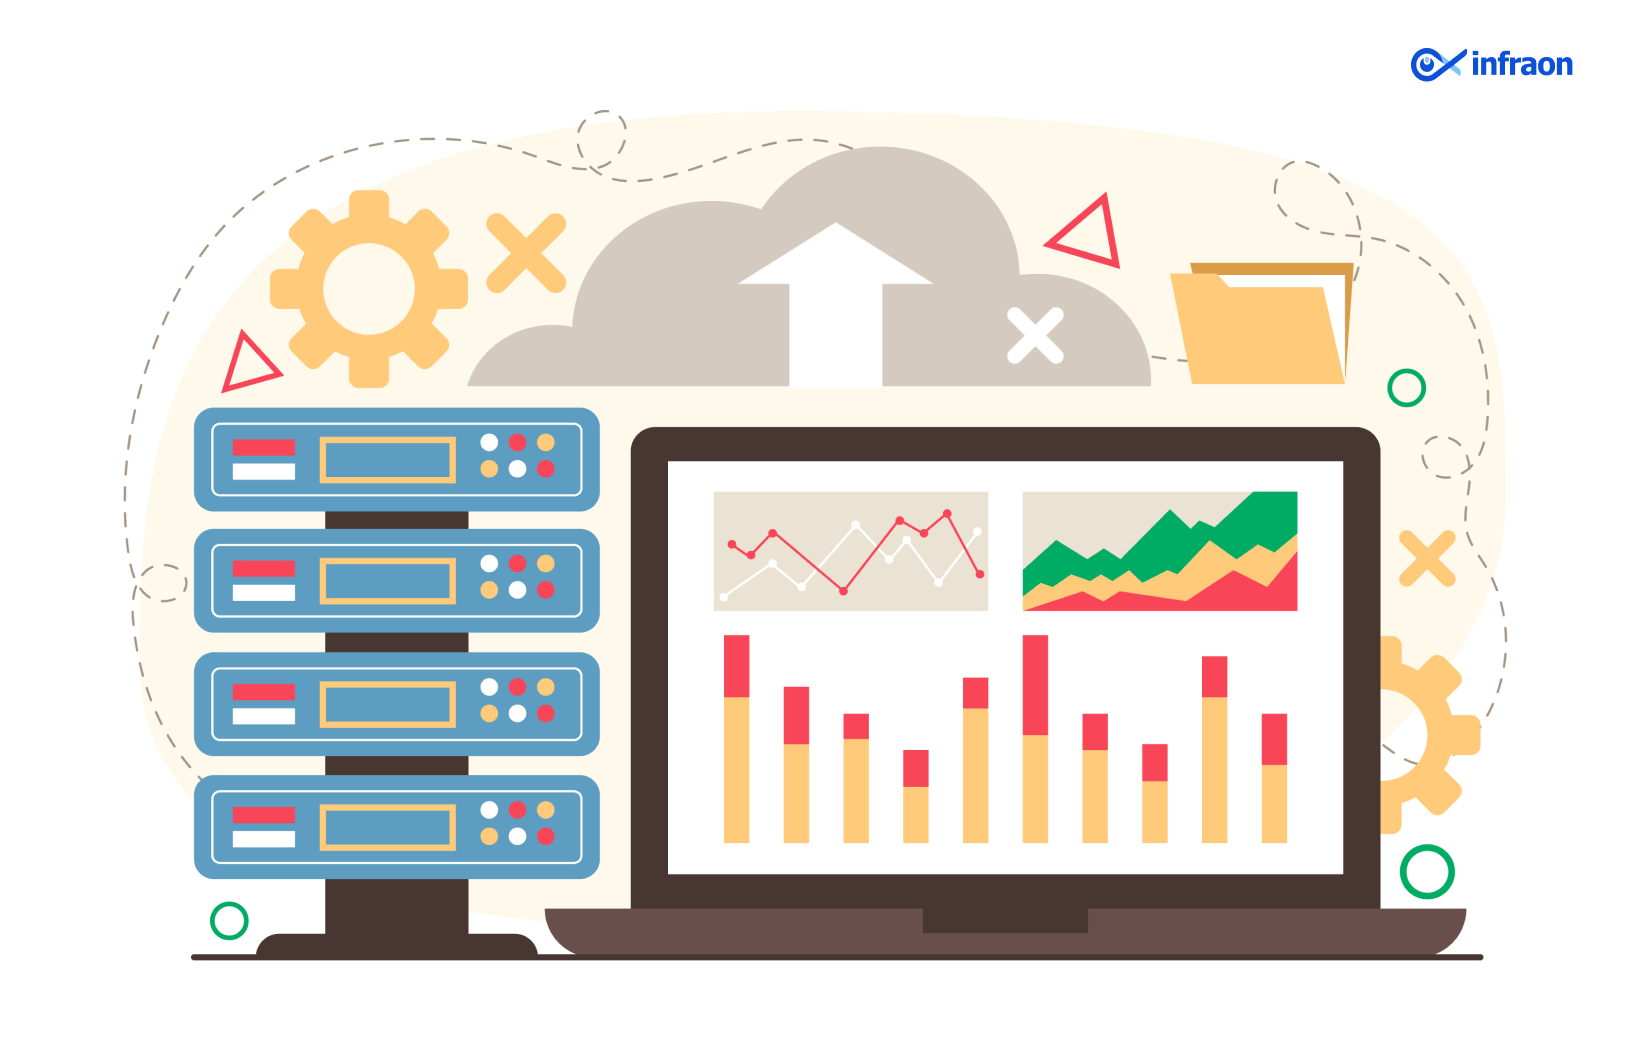
Every storage system, on-site or in the cloud, keeps its data on a server. The disc is divided into partitions to arrange files according to usage and facilitate read/write operations. A partition may house all or a portion of the disc space. The amount of space the storage device requires to read/write a process is indicated by disc usage.
The web hosting server receives a request when a user clicks to access any information. The data is now stored in the server on files kept on discs, often known as hard disc drives. The disc rotates to the necessary disc sector before reading the user’s requested data. Although it only takes a few moments, the CPU must wait while waiting for that file to be read. (Similar event occurs with the write operation.)
Related article: IT Operations Management (ITOM) Best Practices
The processing of numerous data requests by the data-intensive servers gradually increases this access time, making it a performance bottleneck to get the data out of the storage device. Therefore, it is crucial to keep an eye on disc utilization and disc I/O for any potential performance concerns so that you can identify which applications are using the disc as a critical component of their basic functioning. It will help you avoid performance glitches caused by disc latency.
What is Disk I/O?
Disk I/O comprises all read, write, and input/output operations involving a physical disc measured in KB/s. It monitors active disc I/O time or, to put it another way, the pace at which data is transferred from the hard drive to the RAM. It describes storage devices such as HDDs, SSDs, and SAN as performance indicators.
Monitoring metrics such as the used and available (free) space, disc I/O, disc queue length, idle time, and busy time of the total disc and each of its partitions can help you determine how intensive the server workload is. It is especially advantageous when the server is almost at capacity.
These are crucial server performance indicators since high disc consumption will slow down applications and reduce server performance. Check the disc consumption across all servers in your production environment with the help of a report that the server monitoring tool also offers. It enables you to identify the partition that is using up much space or leaving space available so that you may choose the best course of action.
What impacts I/O performance?
The number of input/output operations that can be completed per second should be your primary concern for random disc access (a database, mail server, file server, etc.). Input/output performance is affected by four main factors:
- RAID Component: Your application employs many drives in a RAID arrangement for storage, which increases dependability and redundancy. For write operations, some RAID setups impose a substantial cost. Every write request in a RAID 6 array necessitates six-disc operations. A written request for RAID 1 and 10 needs two-disc operations. The IOPS capacity increases as the number of disc operations decrease. The breakdown of RAID and IOPS performance in this post is excellent.
- Reading and Writing Demands: Your IOPS will be much lower if you have a high proportion of write operations and a RAID configuration that executes numerous operations for each write request (like RAID 5 or RAID 6).
- Multidisc Arrays: Higher IOPS are correlated with more discs in the array. Two discs can perform 300 IOPS compared to one disk’s 150 IOPS.
- Average IOPS per drive: The total IOPS capacity increases with the number of IOPS that each disc can support. The drive’s rotating speed mainly determines this.
Importance and Features of Disk Monitoring:

Predictive Analysis:
The predictive analysis aids in more accurately identifying potential disc usage and performance concerns before they worsen and cause major performance degradation difficulties. The disc capacity can be proactively rebalanced, and extra disc space can be added when needed.
You can predict your disc consumption depending on your current use for the next week using options for capacity and forecasting disc usage. It is accessible for both the whole drive and each partition. By analyzing these tendencies, one may get a head start on prospective problems and take decisive action when necessary.
Automation:
By fixing disc performance issues automatically, automation improves server health and saves time. The predefined automation tools offered by IT Automation make it possible to automate processes like moving logs from one partition to another.
Consider an e-commerce application that uses the disc partition to store transaction logs. The application’s performance is slowed when the partition is more significant than 90%. Although the disc monitoring program notifies the user of the increased disc consumption with an alert, the audit logs must be manually transferred from /home to /backup, another disc partition. This task can be automated by uploading a script file or executing instructions that relocate the logs when the threshold is crossed.
Focus on the layers of the disc:
Monitoring metrics such as the used and available (free) space, disc I/O, disc queue length, idle time, and busy time of the total disc and each of its partitions can help you determine how intensive the server workload is. It is especially advantageous when the server is almost at capacity. These are crucial server performance indicators since high disc consumption will slow down applications and reduce server performance.
Check the disc consumption across all servers in your production environment with the help of a report from the server monitoring tool. It enables you to discover the division that is taking up a lot of space or space, allowing you to choose the best course of action.
Setting disc thresholds:
You can define thresholds for the entire disc, all partitions (global setting), and each disc partition separately. Consider the disc as a water tank with disc partitions in each chamber. You can set the thresholds for
- The complete tank (disc), with the disk’s threshold value.
- A threshold value unique to a single chamber (individual partition), such as the E: drive.
- A single standard threshold value for all partitions throughout all chambers.
Improve Server Efficiency:
Server monitoring offers more than 50 performance metrics, including monitoring for CPU, RAM, logs, services, and processes, in addition to disc monitoring, to make sure your server performance is optimum. Additionally, you can monitor over 100 plugin integrations, including SQL, IIS, Docker, Active Directory (AD), and Hyper-V.
Related article: What is Problem Management? All you Need to Know
Final Note:
To prevent the corruption of your important data, it is critical to know how to monitor the health of hard drives. By simply scheduling disc checks, events, or tasks, disc monitoring software can assist you in detecting logical, mechanical, and physical hard drive problems early. The disc is divided into distinct sections known as partitions to arrange files based on usage and execute read/write operations. When there are problems with hard disc speed, storage, or performance, the tools give alerts and make wise recommendations based on the type of events.
All storage devices are employed to store or preserve data in a server, whether on-premises or in the cloud. A partition may house all or a portion of the disc space. The amount of space used by the storage device during a read/write operation is indicated by disc usage. Disk monitoring will assist you in identifying and correcting your extravagant, expensive code. You may spend more time programming and less time troubleshooting thanks to its automatic identification of N+1 SQL calls, memory bloat, and other code-related problems.


